
Rodent Auditory Brainstem Response Test
From$890
4 models
Description
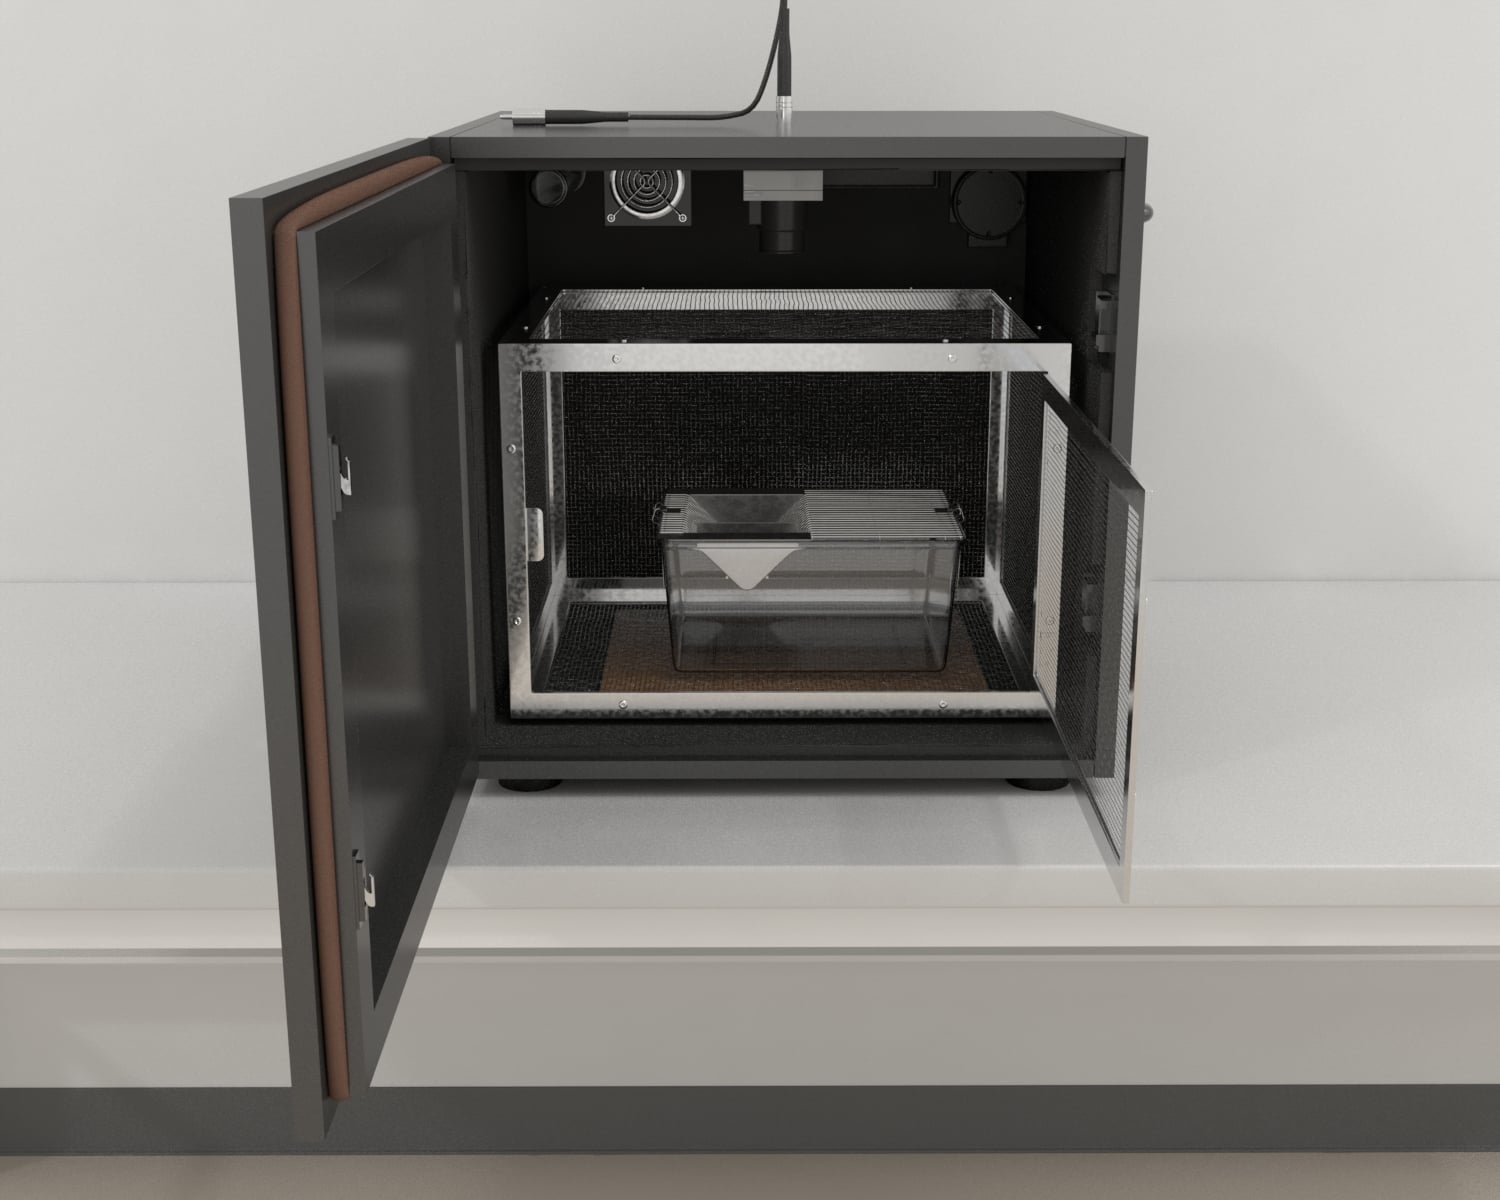
The Maze Engineers Rodent Auditory Brainstem Response Test package is used to assess the function of the auditory pathway in the brainstem of rodents. In this offers neurophysiological test, clicks or short tone bursts are presented to the ear and the resulting electrical activity is measured from electrodes placed on the skin over the brainstem. The responses to these stimuli are used to assess the integrity of the auditory nerve and various brainstem nuclei. The ABR test is commonly used to evaluate hearing thresholds in rodents, and can also be used to detect damage to the auditory pathway or to assess the efficacy of drugs or other interventions that may affect auditory function.
Maze Engineers offers Rodent Auditory Brainstem Response Test

Features
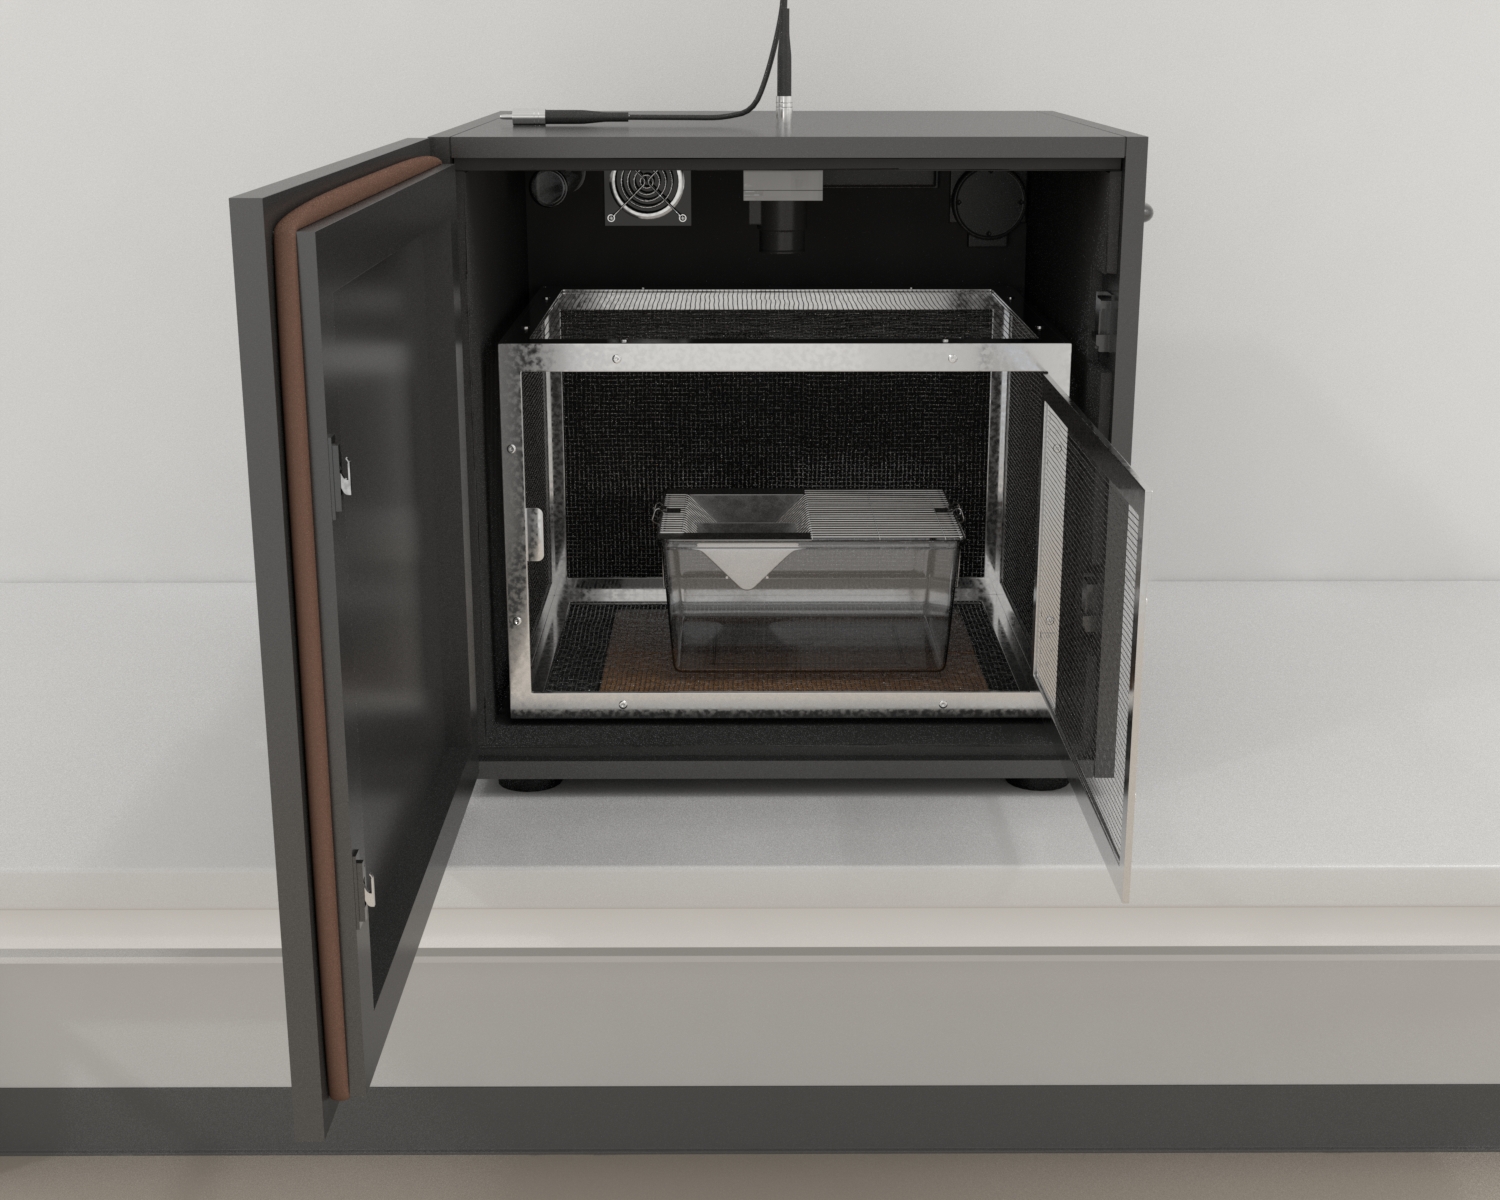
Isolation Cubicle:
- 50(w) x 40(d) x 50(h) cm
- Includes an LED light and IR light, camera holder, and external device slot.
- Includes animal enclosure
Maze Engineers control box
- Connects the TDT RZ6 processor to send a TTL signal of voltage (5v duration 100ms) before every stimulus
Sound generator and Stimuli
-
- Tone frequency - 100-20,000Hz frequency
- Volume in decibels up to 130dB
- Duration in milliseconds
- White noise and narrow white noise stimulus: Octave, 1⁄2 Octave, 1/3 octave and 1/6 octave
TDT RZ6 Multi-I/O high-frequency auditory processor
Recieves signals from the Maze Engineers control box before each stimulus (5v, 100ms)
Speakers
- Dual high-quality speakers, one speaker for tone and the other speaker for white noise
- Dimensions: 33(w)*10(d)*18.5(h) cm
Real-time sound lever reader
-
- Sound level reading in decibels is measured in the inner chamber and is displayed on the PC monitor in real-time.
- Sound level meter is able to measure a wider sound frequency range of up to 20K Hz with high accuracy.
Software:
- Conduct ABR Maze software
- Protocol setup: user can specify a sequence of sound stimuli with fields (frequency, dB level, phase, duration)
- Display the sound dB level at run-time
- Sound stimuli include tone, white noise and narrow white noise
- Experiment protocols and results are saved on the PC
- Support up to 4 units simultaneously
- Integration with video tracking software such as EthoVision, ANY-Maze, or Behavior Cloud
Price
Mouse Auditory Brainstem Response Test
$24,850
Includes:
- Isolation Cubicle
- Animal enclosure
- Maze Engineers control box
- TDT RZ6 Multi-I/O high-frequency auditory processor
- Speaker
- Real-time sound lever reader
- Electronic controller and sound generator
Maze Engineers Sound System
$7,990
Includes:
- Maze Engineers control box
- Speaker
- Real-time sound lever reader
- Electronic controller and sound generator
Brain response recorder
$16,450
Incudes:
- TDT Rz6 Multi-I/O high-frequency auditory processor
Conduct ABR software
$890
- Conduct ABR Maze software
Track rodents with ConductVision
ConductVision is our video-tracking software. Record your sessions on video, and it scores standard rodent tests, such as those listed below.
Examples of tests it scores
To check whether ConductVision scores your protocol in this apparatus, ask in your quote request.
Add ConductVision to your quote
A 5-year license is $3,990 in total.
Results export as CSV files.
Documentation
Introduction
Auditory Brainstem Response (ABR) testing was first performed in humans by Jewett and Williston in the late 1900s (Jewett & Williston, 1971). The neurophysiological test is used in the research and diagnosis of neural disorders and hearing sensitivity (Galambos, & Hecox, 1978; Sohmer, Freeman, Friedman, & Lidan, 1991). In animal research, auditory stimuli are common in many behavioral assays and protocols, such as the Fear Conditioning Assay and Sociability Chamber. Differences in hearing sensitivities within the tested cohort, thus, can have a significant impact on the behaviors of the tested animals and the observed results. While, in animals, vocalization may not be the primary form of communication, in humans, voice communication plays an important role in the quality of life.
Auditory brainstem responses are evoked potentials recorded using electrodes placed close to the scalp of the subject. On presentation of sound stimuli, the auditory brainstem pathways, which include the cochlear ganglion neurons and subsequent fiber tracts and nuclei, produce electric responses that can be used to gain insights into the integrity of these neural structures. The recorded ABR consists of five identifiable waveform components labeled as I to V, which reveal the activation of the auditory nerve and the transmission of the sound through the brainstem pathway.
Apparatus and Equipment
The Rodent Audible Brainstem response test includes a sound-attenuating isolation cubicle with an animal enclosure, LED and IR lights. An external device can be connected using a device slot (location can be customized). A camera mount is located at the top of the chamber.
The Maze Engineers control box connects to the TDT RZ6 processor to send TTL signals before each stimulus is produced.
Sound stimuli are generated using a sound generator with highly customizable parameters. Two speakers deliver sounds as either tones or white noise. A sound reader monitors sound levels.
The rodent neuronal pathway related to hearing sends electrical signals in response to the stimuli which the TDT RZ6 then collects high-fidelity recording of neural activity, stimulus waveforms, and behavioral events.
Conduct ABR Maze software allows for customizable sound stimuli protocols with parameters such as frequency, dB level, phase, and duration.
Hardware Set-up and Testing
Set-Up with TDT Computer Workstation
The following procedure describes how to set-up your TDT system 3 with TDT WS8 or WS4 Computer Workstation and associated hardware for ABR testing and recording.
Workstation
- Connect the input/output devices such as your keyboard, mouse, and monitor(s) to your workstation via USB connections (10 ft. USB extension cables available) on the back panel. WS8 (high-performance; supports two monitors) and WS4 (high-quality; supports single monitor) video cards are included in the kit along with DVI cables to support up to two monitors.
- Connect the workstation to a power source using the included AC power cable on the back panel. Power on the system with the switch provided on the back panel, and press the Power button provided on the front panel to start the device.
Connecting Interface-dependent Devices
- Use the fiber optic patch cable to connect the processors with your workstation's Optibit optical interface card ports. Match the red collar strand of the duplex cable with the OUT port and the blue-collar strand with the IN port on the back panels of the devices. Align the raised key with the keyway notch while holding the boot of the connector and push it into the boot until you hear a click sound for a secure connection.
- Set the ‘Parent/Child’ switch to Parent for the Optibit optical interface card, if present.
Connecting Multiple Devices
- For connecting multiple devices, use a daisy chain configuration using single-strand cables. On the fiber optic port of the workstation's Optibit optical interface card, connect the red collar strand to the OUT port and the blue-collar strand to the IN port.
- Set the ‘Parent/Child’ switch to Parent, if present.
- Connect the blue end of the strand to the To PC(zBus) port on the first processor’s back panel.
- Using another single strand cable, connect the red end to the first processor's output (OUT) and the other end (blue) to the input (IN) of the second processor's interface port. Repeat process for all additional devices with a PC-to-zBUS interface.
- Connect the free end of the cable connected to the IN port of the workstation to the OUT port of the last processor's interface.
- Connect all devices to a power source and power on the components.
Testing the System
- Open the zBUSmon utility by clicking on the zBUSmon program shortcut on your desktop to begin testing the connection between the computer and the processor(s).
- Check the Show Statistic radio box and click on the Transfer Test button to begin test data transfer both to and from the PC.
- On a successful test, a test passed message will appear, and the amount of data transferred, with no errors, will be displayed.
Set-up with Non-TDT Computer
TDT Driver Installation
- Install the TDT drivers using the accompanying CD or through the website.
- In the installation window, select TDTDrivers in the software list and click the Install button to run the TDT Driver and RPvdsEx installation.
- Allow permission to install and follow the InstallShield Wizard guidance for installation.
- On the TDT Driver Setup page, select the appropriate set-up type (below) and click next.
- System 3 with Optibit interface as default: For systems with an Optical interface (PO5/PO5e/PO5c).
- System 3 with USB 3 interface: For systems with only the USB 3.0 interface (UZ3).
- System 3 with legacy USB interface: For systems with only the USB interface (UZ2).
- Click Install and Finish on completion. Restart your system to complete the driver installation.
- For any additional driver or software installation needed for your system, return to the CD and continue with the appropriate installations.
TDT Equipment Set-up
- Computer System Optibit Interface Card
-
-
- Install the PCI card into your computer.
- Restart your computer and complete the driver installation.
-
- Laptop or Systems with USB 3.0 interface
-
- Connect the UZ3 to your laptop/PC USB 3.0 port.
- Complete the driver installation.
- Assembly of zBus Chassis
- Connect the red end of the optic fiber cable to the OUT port (marked with a red dot) on the PO5/PO5e/PO5c, or the RED labeled port on the UZ3. Connect the blue end of the cable to the port labeled IN on the Optibit interface.
- Connect the red end of the second optic fiber to the port labeled OUT on the Optibit interface. Connect the other end of this cable to the input of the PO5/PO5e/PO5c/UZ3.
- Use a daisy chain configuration as described earlier to connect multiple devices to the chassis.
- Connect all devices to a power source and power on the components.
- Test the system connections and using the Transfer Test from as mentioned earlier, using the zBUSmon program.
TDT Equipment Set-up (Legacy USB Interface)
- Use the A-to-B type USB cable and connect the UZ2 chassis to the USB port of your system.
- Use a short patch cable to connect the Sync In of the child USB module with the Sync Out of the parent clock. The parent USB module's clock will be used to synchronize all clocks on the zBus device chassis. Correct connectivity will be indicated by child devices having a lit LED indicator while the LED on the parent module will be off.
- For connecting multiple devices, use a daisy chain configuration between the child chassis.
- Connect the chassis to a power source and power on the modules. Allow the system to install drivers for each TDT hardware prompt.
- Test the system connections and using the Transfer Test from as mentioned earlier, using the zBUSmon program.
Set-up for Cluster Computing
- Set-up your individual systems first. Ensure all your systems support Ethernet, network connection and have a PO5c System 3 interface card installed.
- Connect the nodes using the Cluster fiber optic ports on the PO5c cards. Connect the output of Node 0 to the input of Node 1, the output of Node 1 to the input of Node 2, and so on until all nodes are connected, and the final output is connected to Node 0 input.
- Connect the Ethernet port of all your nodes to a shared network.
- For all child nodes (Node 0 parent node), set the Parent/Child switch to the child.
- Run the zBusMon program on the parent node to test all connections. Repeat with child nodes.
Protocol
Follow appropriate laboratory protocols, surgical hygiene, and animal welfare practices before commencing. Clean and sterilize all surgical equipment and other apparatus.
The following protocol considers a mouse as the subject. The protocol can be applied to other small rodents as well.
Animal Anesthetization
- Anesthetize the subject using a mixture of ketamine hydrochloride (100 mg/kg) and xylazine hydrochloride (10 mg/kg) intraperitoneally injected using a 1 ml insulin syringe and precision glide needle.
Note: Ketamine and xylazine solution provides stable ABR thresholds in comparison to other methods of anesthetization.
- Place the subject singly in a warm (~37°C) and clean cage. Check on for the depth of anesthesia after approximately two to five minutes using methods such as tail pinch, foot pinch, and monitoring respiration rate.
Animal Preparation
- Remove the subject from the cage and place it in a sound-proof chamber with a non-electric heating pad to maintain body temperature during testing. Use a rectal probe to monitor temperature throughout.
- Apply protective ophthalmic ointment on the subject's eyes to avoid corneal desiccation and disturbances from blink reflexes during testing.
- Position the subject 10 cm away from the speakers, ensuring the center of the speaker is aligned with the external auditory canal of the subject.
Electrode Positioning
- Insert subdermal electrodes 2-3 mm under the skin at the forehead (active electrode), below the pinna of the left ear (reference electrode), and below the contralateral right ear (ground electrode).
Recommended: Binocular surgical magnification microscope with a cold light source.
- Verify proper electrode positioning/conductivity of each electrode by ensuring the impedance is less than 5 kΩ.
- Close the sound-proof chamber to begin ABR testing.
- Perform ABR testing in a free field condition. However, measuring each ear separately can be done with the help of an ear tubing (close field).
Recording Click and Tone Bursts ABR
- Calibrate the hardware and software for ABR testing and program the stimulus protocols for the clicks and tone bursts.
- Record the ABR until waveforms are no longer clearly present. Determine the lowest recognizable ABR threshold value by watching the first 5 peaks within the first 10 milliseconds.
- Save the waveforms for analysis and future reference.
Post ABR Testing and Recovery
- On completion of recordings, remove the electrodes gently and remove the subject from the sound-proof chamber.
- Place the subject in a warm and clean cage to recover from anesthesia.
- Return the subject to its home cage only when they return to their feet when placed on their backs.
Data Analysis
These data recored from the rodent auditory brainstem response apparatus can be used to evaluate hearing function, diagnose hearing disorders, study the effects of ototoxic drugs or noise exposure on the auditory system, assess the efficacy of hearing protection devices or therapies, and investigate the neural mechanisms of hearing and auditory processing.
- Hearing threshold: The minimum sound intensity required to elicit an ABR waveform. This is an objective measure of hearing sensitivity.
- Latency: The time interval between the onset of the acoustic stimulus and the occurrence of the corresponding ABR peak. This provides information about the speed of neural conduction along the auditory pathway.
- Amplitude: The magnitude of the ABR peak, which reflects the number of synchronized firing of auditory neurons. This can indicate the integrity of the auditory pathway.
- Waveform morphology: The shape of the ABR waveform, which can reveal information about the functional organization of the auditory system and the type of hearing loss.
- Interwave interval: The time interval between successive ABR peaks, which can provide insights into the timing and processing of auditory information.
- Signal-to-noise ratio: The difference between the amplitude of the ABR response and the background noise level, which reflects the quality of the ABR recording and the reliability of the measurement.
Literature Review
Assessment of otoprotective effects of α-lipoic acid
The subjects included postnatal 7 days old A/J mouse pups that were randomly divided into untreated groups, the DMSO (dimethyl sulfoxide) group, and α-lipoic acid + DMSO group (a-lipoic acid-treated group). The α -lipoic acid group received a dose of 50 mg/g of body intraperitoneal injections of α-lipoic acid dissolved in DMSO (50 mg/ml) on alternate days, while the control group received an equal amount of vehicle only. ABR testing for all groups was performed at ages 3-, 4-, 6-, and 8-weeks using stimuli of click and pure-tone bursts (8 kHz, 16 kHz, and 32 kHz) by reducing the SPL at 10 dB steps, then at 5 dB steps up and down to the lowest level wherein the ABR pattern could be recognized. The α-lipoic acid group displayed significantly reduced ABR thresholds for both stimuli and all tested frequencies in comparison to the untreated group at ages 4-, 6-, and 8-weeks. Additionally, the α-lipoic acid-treated group also had significantly lower ABR thresholds at 32 kHz frequency at 3-weeks old. In comparison to the control group, overall, the α-lipoic acid-treated group had lower ABR thresholds. (Huang et al., 2020)
Assessment of hearing function in APP/PS1 Alzheimer’s disease mice
The possibility of hearing loss as an early biomarker of Alzheimer's disease was evaluated using APP/PS1 AD mice with wild-type littermates as controls. In addition to ABR testing, mice also underwent distortion product otoacoustic emission (DPOAE) and cochlear microphonics (CM) recordings. ABR recordings were performed monthly starting at postnatal day 60 to evaluate progressive changes and early occurrence of hearing loss. The testing was performed with clicks and a series of tone bursts with frequencies between 4 to 40 kHz, sound pressure intervals (SPI) in steps of 5 dB from 10 to 80 dB using a high-frequency speaker. For mice with severe hearing loss, sound pressure intervals range of 70 to 100 dB were used. A significant increase (10−20 dB SPL) in the ABR thresholds was observed in APP/PS1 AD mice in comparison to the wild-types. At 40 kHz, the ABR thresholds increased by approximately 20 dB SPL in APP/PS1 AD mice. Hearing loss was also observed to be progressive and age-based. Comparison between the two groups revealed APP/PS1 mice to display hearing loss as early as two months old at high frequency. These mice also had reduced DPOAE, though no reduction in CM could be observed. (Liu et al., 2020)
Investigation of peripheral hearing function in a mouse model of Alzheimer's disease
Prior to being submitted to ABR testing, Male and female 5xFAD mice and their wild-type counterparts were evaluated for their acoustic startle and pre-pulse inhibition (see Acoustic Startle Chamber). An age-related decline in acoustic startle responses was observed for 5xFAD mice. Following the acoustic startle testing, mice were subjected to ABR testing in age-grouped cohorts of mixed sexes; a 3-4 months group and a 13-14 months group. Testing was performed using tone bursts stimuli of 2, 4, 8, 16, and 32 kHz, 10 ms duration, and 1 ms rise/fall time using a loudspeaker. Tones were presented with an SPL of 5 dB, in descending sequence from 90 dB for each frequency. Thresholds were determined based on the repeatable III wave in ABR at the lowest sound level. Each ABR testing session lasted about 45 minutes. While no genotype differences could be observed for 3-4 months old mice, a significant effect of stimulus frequency could be seen. The 5xFAD mice displayed higher thresholds than the WT at 13 to 14 months of age, with an average ABR threshold of 82.2+/-4.8 dB in comparison to the 55.4+/-6.5 dB for WT mice. Additionally, it was observed that at frequencies of 8, 16, and 32 kHz, the auditory thresholds of the 5xFAD mice were significantly higher than the WT group. While an increase in auditory threshold with age for WT was only observed at 2 and 4 kHz, the mouse model displayed an increase for all frequencies. Together with the results of cochlear morphology, it was confirmed that the aged 5xFAD mice presented significant peripheral hearing loss. (O'Leary et al., 2017)
Investigation of the effect of Sap B deficiency on hearing
The study was conducted using C57BL/6J Sap B KO (B-/-) mice backcrossed to an FVB (Friend leukemia virus, strain B) strain to the 10th generation. The B-/- mice, Heterozygote (Het), and wild-type (WT) littermates (P1mo–P15mo) were subjected to Auditory Brainstem Response testing to determine the effect of Sap B deficiency on hearing in this progressive neuronal degeneration model. Mice were tested using clicks (5 ms duration, 31 Hz) and tone pips at 8, 16, and 32 kHz (10 ms duration, cos2 shaping, 21 Hz) at ages P1mo, P3mo, P4mo, P6mo, P8mo, P13mo, and P15mo. Electroencephalographic (EEG) activity was recorded for each stimulus for 20 ms (at a sampling rate of 25 kHz) and filtered (0.3–3 kHz). 512 stimuli and 1000 stimuli were averaged from the waveforms for click stimuli and frequency-specific tone pips, respectively. The Auditory Brainstem Responses were recorded down from the maximum amplitude in SPL of 5 dB. No significant differences in ABR thresholds were observed between the three cohorts at age P4mo; however, an increase in ABR thresholds for tone-burst stimuli only was observed in B-/- mice in comparison to the other two groups at P8mo. Further, no significant difference in thresholds could be observed for WT versus B-/- mice in click stimuli until P13mo, though significant threshold shifts for pure-tone stimuli were observed starting at P6mo. While no significant difference in ABR wave I amplitude for click stimulus could be seen at Pmo4, however, by P8mo, B-/- mice had a significant decrease in ABR amplitude in comparison to WT counterparts. Comparison of ABR interpeak latency between P1 and P2 at varying time points revealed that B-/- mice displayed significant P2-P1 delays for tone stimuli at P8mo. (Akil et al., 2015)
Recommendations, Considerations, and Precautions
- Prior to anesthetization of the subjects, calibrate, program, and check all devices and equipment for proper functioning.
- Use a Faraday cage inside the sound-proof chamber to prevent interference from external electronic devices.
- Use a non-electric heating pad during ABR testing to avoid any interferences during recordings.
- To prevent the possibility of the subject waking up during ABR recording sessions (approximately 40-minute sessions), inject one-fifth of the original dose of the anesthetic at about 20 minutes during testing.
- Provide appropriate post-experimental recovery and pain management to the subjects following ABR recordings.
References
- Akil, O., Oursler, A. E., Fan, K., & Lustig, L. R. (2016). Mouse Auditory Brainstem Response Testing. Bio-protocol, 6(6), e1768. https://doi.org/10.21769/BioProtoc.1768
- Akil, O., Sun, Y., Vijayakumar, S., Zhang, W., Ku, T., Lee, C. K., ... & Lustig, L. R. (2015). Spiral ganglion degeneration and hearing loss as a consequence of satellite cell death in saposin B-deficient mice. Journal of Neuroscience, 35(7), 3263-3275.
- Galambos, R., & Hecox, K. E. (1978). Clinical applications of the auditory brain stem response. Otolaryngologic Clinics of North America, 11(3), 709-722.
- Sohmer, H., Freeman, S., Friedman, I., & Lidan, D. (1991). Auditory brainstem response (ABR) latency shifts in animal models of various types of conductive and sensori-neural hearing losses. Acta oto-laryngologica, 111(2), 206–211. https://doi.org/10.3109/0001648910913737
- Jewett, D. L., & Williston, J. S. (1971). Auditory-evoked far fields averaged from the scalp of humans. Brain, 94(4), 681-696.
- Lundt, A., Soos, J., Henseler, C., Arshaad, M. I., Müller, R., Ehninger, D., ... & Weiergräber, M. (2019). Data acquisition and analysis in brainstem evoked response audiometry in mice. JoVE (Journal of Visualized Experiments), (147), e59200.
- O'Leary, T. P., Shin, S., Fertan, E., Dingle, R. N., Almuklass, A., Gunn, R. K., ... & Brown, R. E. (2017). Reduced acoustic startle response and peripheral hearing loss in the 5xFAD mouse model of Alzheimer's disease. Genes, Brain and Behavior, 16(5), 554-563.
- Liu, Y., Fang, S., Liu, L. M., Zhu, Y., Li, C. R., Chen, K., & Zhao, H. B. (2020). Hearing loss is an early biomarker in APP/PS1 Alzheimer’s disease mice. Neuroscience letters, 717, 134705.
- Huang, S., Xu, A., Sun, X., Shang, W., Zhou, B., Xie, Y., ... & Han, F. (2020). Otoprotective Effects of α-lipoic Acid on A/J Mice with Age-related Hearing Loss. Otology & Neurotology, 41(6), e648-e654.